
Price Tells You Where.
Time Tells You When.
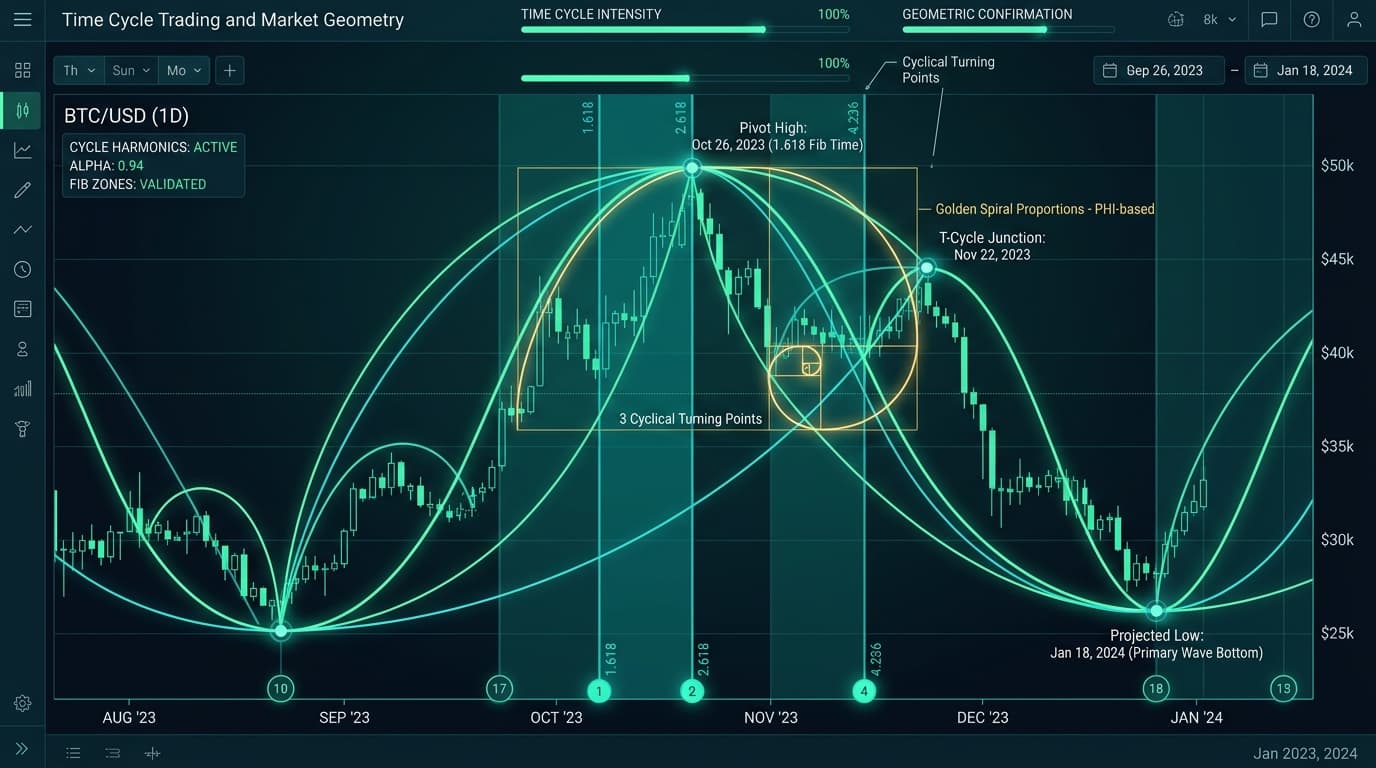
90% of retail traders lose because they obsess over price levels while remaining completely blind to the dimension of Time. Discover how institutional time cycles anticipate market turning points days before breakout traps trigger.
Why Traditional Indicators Keep You Trapped
Most technical indicators (RSI, MACD, Moving Averages, Supertrend) are strictly derivatives of past price. By the time they flash a buy signal, the institutional move is already exhausting.
Lagging Indicator Traps
- ✕Waiting for EMA crossover after 80 points of Nifty rally has already occurred.
- ✕Buying breakout at resistance exactly when institutional cycles hit exhaustion.
- ✕Wide stop-losses with unfavorable 1:1 or 1:0.8 risk-to-reward ratios.
- ✕Constant emotional churn and revenge trading caused by false whipsaws.
Time Cycle Forecasting
- Projecting the exact reversal calendar date 5 to 10 trading sessions in advance.
- Entering positions at the origin of the turn before the public breakout candle triggers.
- Asymmetric risk:reward (1:4 to 1:6) with tight mathematical invalidation points.
- Complete emotional serenity: you execute only on predetermined high-conviction dates.
The Four Pillars of Price-Time Mastery
Every trade executed by Amit Gupta is filtered through four distinct mathematical parameters, eliminating emotional impulse and subjective opinion.
Harmonic Cycle Rhythms
Financial markets do not move in random chaos. They breathe in measurable daily, weekly, and 60-day institutional vibration rhythms driven by capital settlement cycles.
Price-Time Squaring
Based on W.D. Gann's law of cause and effect: When Price units match Time units in geometric proportion, an explosive trend reversal or accelerated breakout is mathematically compelled to occur.
Turn Date Anticipation
Retail traders wait for lagging indicators like MACD or RSI to cross over after 60% of the move has already transpired. Time Cycles project the exact turning date weeks in advance.
Trap Inversion Defense
Smart money engineers breakouts on key resistance levels specifically on cycle expiry dates to absorb retail liquidity. Knowing the turn date turns traps into lucrative reversal trades.
The Anatomy of a Cycle Turn Trade
How a trade develops from initial calendar projection to institutional entry and profit locking.
Cycle Harmonic Measurement
Identify the primary dominant wave length from prior swing low to swing low. Project the forward vibration window.
Price-Time Squaring Confluence
Calculate the exact price level where price units square the elapsed trading days (e.g., 54 days = 540 points).
Turn Date Window Confirmation
Monitor price action 1 session prior to the calculated turn date. Note volatility contraction and institutional orderflow.
Asymmetric Execution
Execute position with a defined low-risk invalidation stop, capturing a multi-day directional trend ahead of the crowd.
See Time Cycle Analysis in Action.
Live Saturday Masterclass with Amit Gupta.
We decode real Nifty, Bank Nifty, and MCX Crude charts, calculate upcoming turn-date windows, and answer your market questions in a 100% free interactive session.
100% Pure Educational Masterclass • Strictly No Advisory or Tips Given.